Knowing which species have been recorded in a place is a starting point. Understanding where those observations come from, when they were made and what coverage they have lets you use them with better judgment.
With SMA Biodiversity Occurrence Records we are adding a new source of background information to Atlas: the records from environmental monitoring campaigns and project baselines in Chile published by Chile’s Superintendency of the Environment (SMA). Lemu Earth Science brings that public database together and organizes it so you can query it by year, browse species and locate records on the map.
For now, the indicator is available in demo zones. To have it calculated for your zones in Chile, ask your Lemu team; the calculation is enabled on request only.
Lemu’s reading
The value of this indicator lies in connecting an observation to its context. It helps you review the biodiversity background around an operation, identify what has been monitored and prepare questions for an environmental assessment or fieldwork.
It shows what was recorded. It does not set out to be an exhaustive species inventory or a classification of the ecological state of a place. Its coverage follows the projects and campaigns that generated records, so it concentrates where monitoring took place. That is why finding few records, or none, does not allow you to conclude that there is little biodiversity.
What information it brings together
The source contains species occurrence records obtained in environmental monitoring campaigns and baselines for projects submitted to Chile’s Environmental Impact Assessment System (SEIA). Holders of projects with an Environmental Qualification Resolution (RCA) must report them to the SMA, in the format set by the SMA’s Exempt Resolution No. 343/2022, and the SMA publishes them as open data.
Lemu Earth Science consolidated the source files and prepared the geographic records for querying in Atlas. The documented steps include normalizing kingdoms and building the scientific name from the genus and epithet. When a record has no coordinates of its own, the processing uses those of its station.
| Feature | Indicator scope |
|---|---|
| Source | Open monitoring data from Chile’s Superintendency of the Environment. |
| Type of information | Occurrence records. Species richness has its own indicator in Atlas. |
| Main unit | Records. |
| Geographic coverage of the source | Chile. |
| Query in Atlas | By year, with filters by kingdom and records on the map. |
| Extraction documented for this version | February 28, 2026. |
| Source update | When the SMA publishes new data, with no estimated date. |
This is not real-time monitoring. The date of an observation, the year selected in Atlas and the extraction date of the database are three different things.
How to explore the indicator in Atlas
1. Review the year and the summary
In a zone where it has been calculated, open SMA Biodiversity Occurrence Records in the Biodiversity category and choose the year you want to look up.
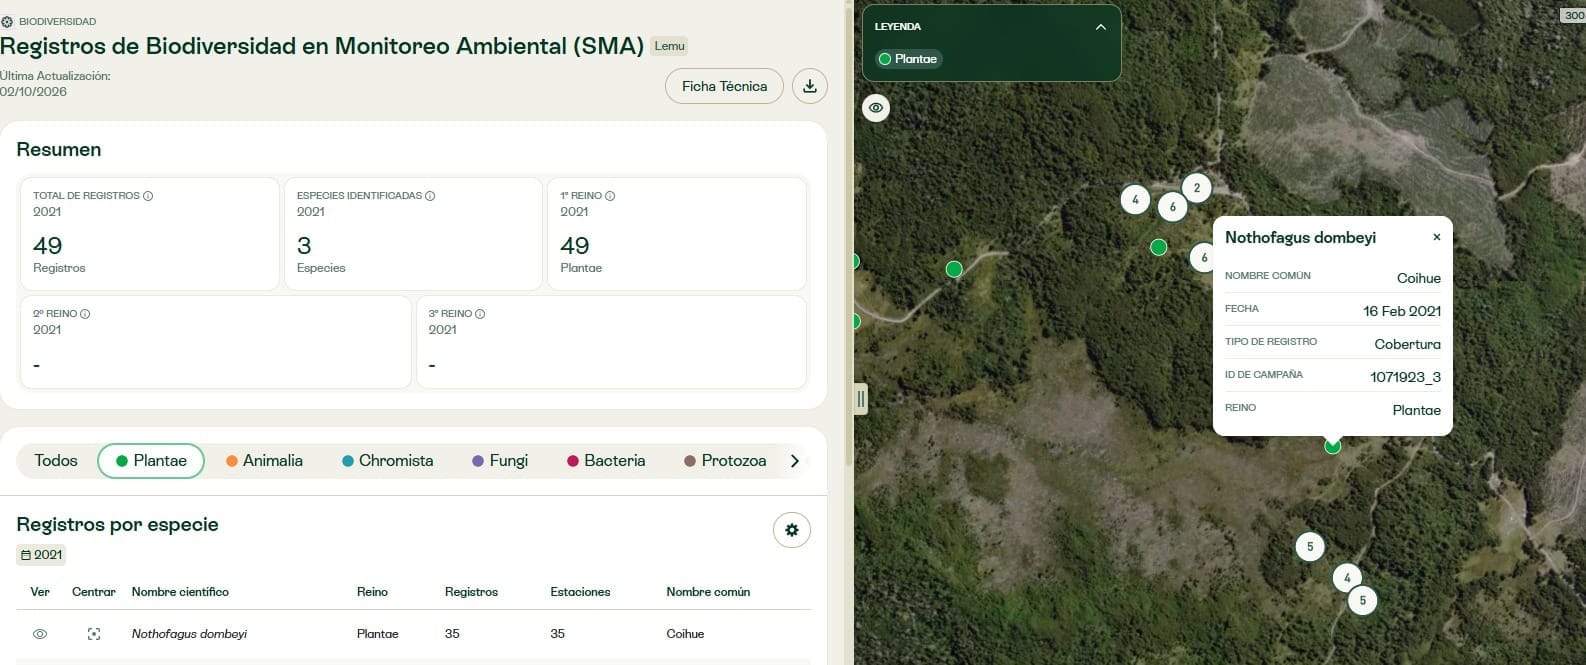
The summary shows the total number of records, the species identified and the records by kingdom for that selection. One species can have several records: the two counts answer different questions.
2. Filter by kingdom and check the table
The tabs filter records by kingdom. The table shows scientific name, kingdom, records, stations and common name, depending on the information available.
The number of stations adds context about how monitoring was distributed. A species recorded many times in a single place tells you something different from one observed at several stations. That figure helps you ask better questions, although the number of records, on its own, does not measure abundance.
3. Open a record on the map
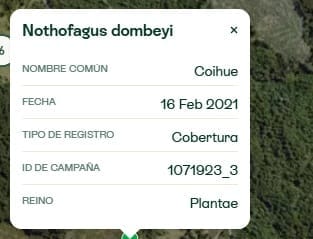
When you select a point, you will see the scientific name and the fields in the view: common name, date, record type, campaign ID and kingdom.
That takes you from a year’s summary to a specific observation. For example, after filtering by Plantae, you can pick a species from the table and locate one of its records to see its date and campaign.
How it can help in your work
Prepare a biodiversity review. Existing records show what has been monitored at a site and around it before you define new questions, studies or campaigns.
Support the background analysis. The date and the campaign place each observation in its context. That adds background to an environmental review, an audit or an assessment process, without replacing whatever verification each case requires.
Identify information gaps. An absence of records raises questions about monitoring coverage. It does not prove that a species is absent, nor is it enough to rule out an on-site assessment.
Strengths and limits to read together
Official provenance, dates and campaign identifiers make the SMA database a useful source for reconstructing background. Those same records call for a careful reading:
- Coverage is uneven. There is more information where projects and campaigns have taken place, so a difference between the counts of two zones may reflect how much each one was monitored.
- Methods vary. Each project holder may use its own protocols, and results from different campaigns are not automatically comparable.
- Not every identification reaches species level. Some records are identified only to genus or family; keep that in mind when reading the count of identified species.
- The source does not publish some sensitive locations. The indicator documentation notes that coordinates are omitted for certain records of protected species, so not every record in the source appears as a point on the map.
- Years do not have the same observation intensity. More records in a period do not prove recovery or deterioration of the ecosystem: there may also be more projects, campaigns or reporting capacity.
When to complement it with other indicators
The SMA indicator answers what was recorded and in what context. To analyze species richness or landscape condition, complement it with the Atlas indicators built for those questions, such as Species Richness or Landscape Integrity.
Sources do not have to tell the same story to be useful. Together, they help you tell apart the evidence available, the characteristics of the place and the questions that remain open.
Request the calculation for a zone in Chile
For now, the indicator is available in demo zones. If your organization has zones in Chile, contact your Lemu team to request the calculation and check which records exist for the area you are interested in. You can also write to us through our contact form.
Data source
Chile’s Superintendency of the Environment: the publication of its biodiversity records database (in Spanish). Processing and description of limits: Lemu Earth Science.